Sujet
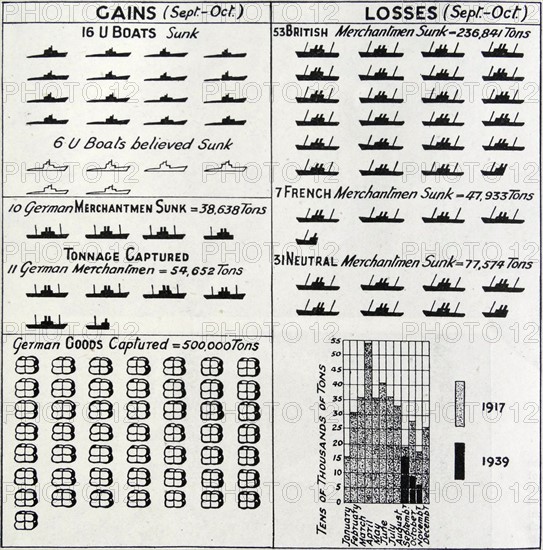
Picture diagram of the Economic War in Germany
Légende
Picture diagram of the Economic War in Germany. The diagram shows the result of the first two months of economic warfare at sea. The right-hand bottom corner depicts the amount of British Merchant tonnage sunk during the months of September, October and November during 1939 in comparison to 1917. Dated 1939
Date
1939
Crédit
Photo12/Ann Ronan Picture Library
Notre référence
ARP18A28_024
Licence
Droits gérés
Format disponible
60.0Mo (2.4Mo) / 38.5cm x 39.0cm / 4552 x 4607 (300dpi)