Title
Ozone concentrations
Caption
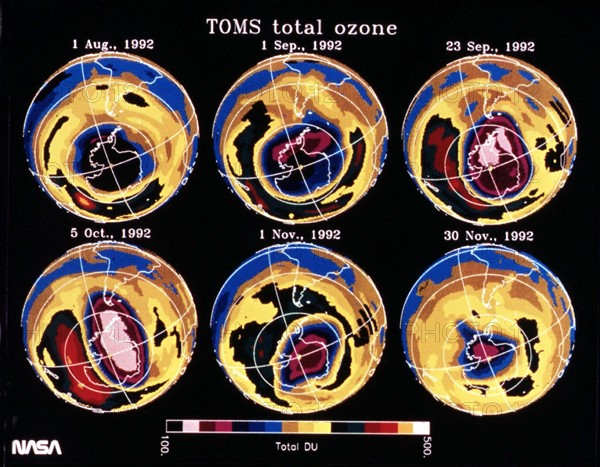
These color images of Nimbus-7/Total Ozone Mapping Spectrometer (TOMS-NIMBUS-7) data show total ozone on six days in 1992. Reds and greens indicate high ozone concentrations, while the blue and purple indicate low ozone concentrations.
Date
1992
Credit line
Photo12/Collection DITE-NASA
Reference
DIT01221_005
Model release
No
License type
Rights managed
Available size
7.1Mb (487.2Kb) / 5.9in x 4.6in / 1780 x 1386 (300dpi)